
 NATURE DEFINE
Service
ND-BioScore
Quantitative biodiversity assessment service
We quantify the state of nature using field data and AI. A single integrated workflow covers everything from field data collection to reporting for TNFD disclosure and applications for Nature Symbiosis Sites (Japan's OECM certification scheme).
Overview
From field data to business action,
in a single workflow
We handle installing equipment and sampling on site, AI analysis, calculating assessment scores and delivering the report data you need for applications and disclosure.
STEP 01
Field data collection
Camera, acoustic, DNA and satellite data combined
The first assessment in Japan to integrate all four methods*
STEP 02
AI analysis
AI developed for research use at the University of Tokyo
Species identified automatically from images and sound
STEP 03
Scoring
Four State of Nature (SoN) indicators calculated
Shown on an intuitive dashboard
STEP 04
Disclosure & action
For TNFD disclosure and Nature Symbiosis Site applications
Interim and annual reports with concrete conservation proposals
* “First in Japan” refers to an assessment that integrates camera traps, bioacoustics, eDNA and satellite imagery, as presented at the 5th Business Forum of the Japan Conference for the 2030 Global Biodiversity Framework (J-GBF), December 2025.
Field data collection
We combine camera traps, bioacoustics, environmental DNA (eDNA) and remote sensing to collect data on nature at the site.
Alignment with the Nature Positive Initiative (NPI) measurement guidance
- preparatory
- medium
- highND-BioScore
ND-BioScore field surveys are designed in line with the requirements of the high level, the highest of the three in the NPI measurement guidance.
Source: Nature Positive Initiative, Initial Measurement Guidance: State of Nature Metrics (October 2026)
* The number and placement of devices are designed for each site, based on its size, vegetation and the purpose of the assessment.
Standardisation
Standardised protocols for
year-on-year and cross-site comparison
When surveyors or survey days change, it is impossible to tell whether a change in species counts reflects nature or simply a different survey. ND-BioScore sets survey effort and observation conditions as a fixed protocol and measures every site, every year, against the same standard, so differences in the data can be read as changes in nature.
01
Tracking change over time
Using the same protocol year after year reduces variation caused by differences between surveys, so change from the baseline year can be shown in numbers.
02
Cross-site benchmarking
Every site is measured with the same indicators, supporting decisions on conservation priorities and where investment will have the most effect.
Same equipment, same steps, same indicators — so results stay comparable across sites, in Japan, at overseas locations and across the supply chain.
Comparison
Expert surveys and ND-BioScore
Standardised survey procedures make biodiversity assessment easier to compare, without relying on the individual judgement of experts.
| Aspect | Conventional field surveys | ND-BioScore (data & AI) |
|---|---|---|
| Scale | Limited expert availability for field work restricts the number of survey points | Less reliance on experts in the field, so survey points can be added easily |
| Reproducibility | Results depend on experts' judgement in the field, and the basis for that judgement is hard to preserve | Assessed against uniform criteria; the stored recordings can be re-checked later |
| Coverage | Data are limited to specific survey dates and times | Records continuously, day and night |
| Data accumulation | Changes over time and differences between sites are hard to compare | Accumulated data allow comparison over time and between sites |
Assessing biodiversity across multiple sites requires consistent survey methods and accumulated data.
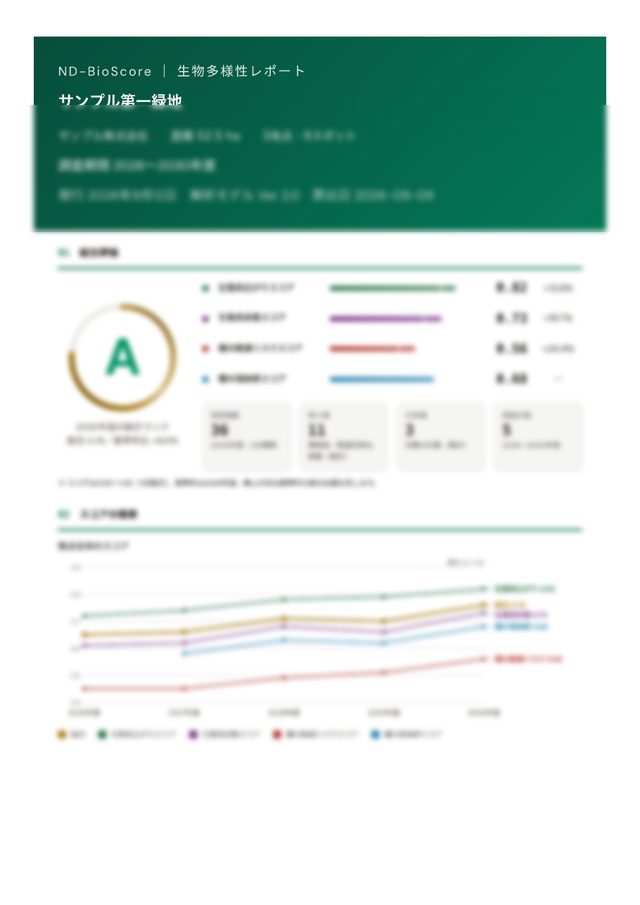
AI analysis and State of Nature dashboard — ND-BioScore
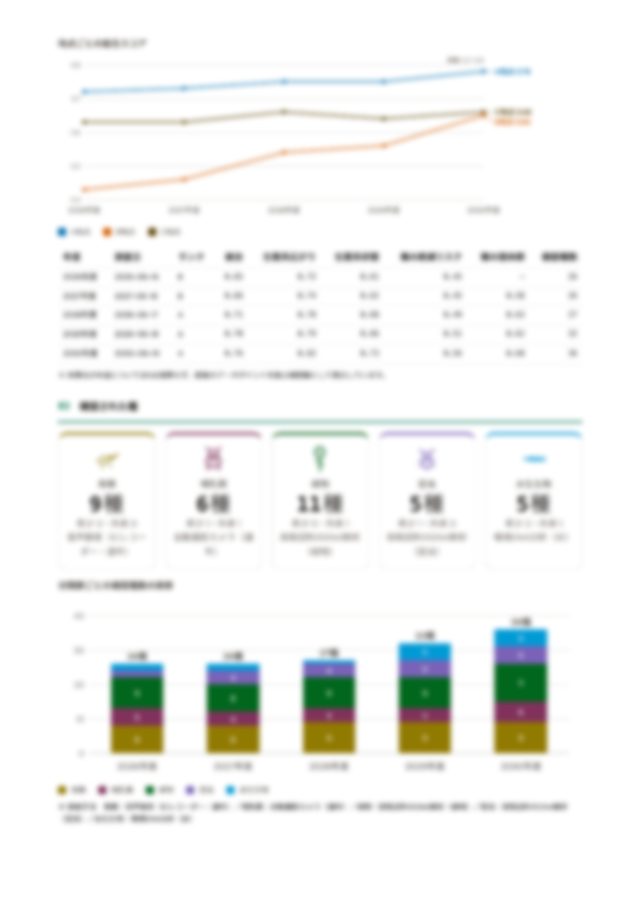
AI developed for research use at the University of Tokyo identifies species from the recordings. We then calculate biodiversity scores aligned with the four SoN indicators and provide them on a dashboard that shows the state of nature at a glance.
| SoN indicators | TNFD (October 2026) | ND-BioScore |
|---|---|---|
| Ecosystem extent | C5.0 Ecosystem extent | Covered |
| Ecosystem condition | C5.1 Ecosystem condition | Covered |
| Species extinction risk | C5.2 Species extinction risk | Covered |
| Species populations | A5.0 Species populations | Covered |
* This table shows how ND-BioScore relates to the indicator frameworks. Whether they can be used for a particular disclosure should be judged against that framework's official requirements.
Demo data. Company and site names are fictitious.
From data to action — ND-Action
Each year, we deliver an advisory report proposing conservation and management actions based on field data.
Interim and annual reports
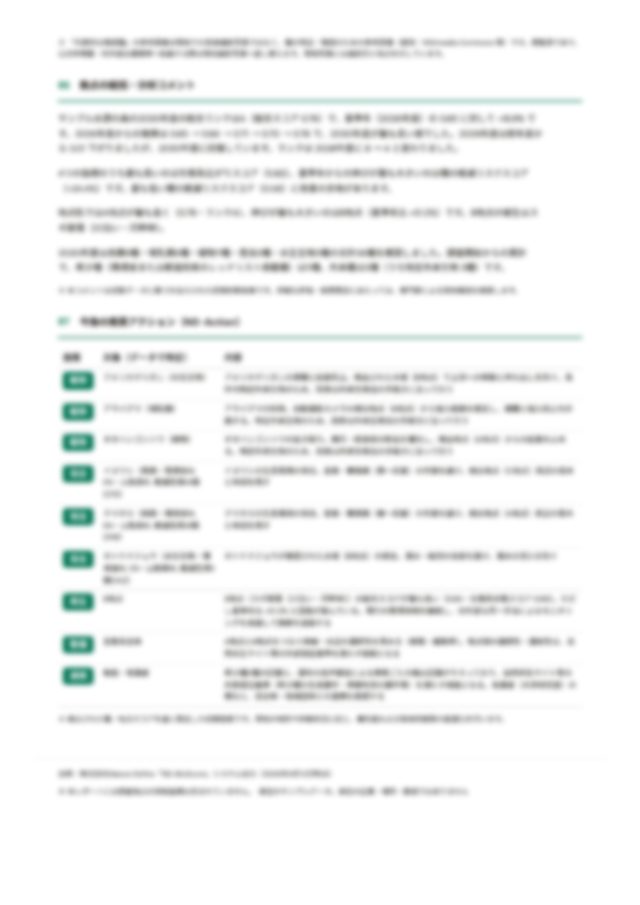
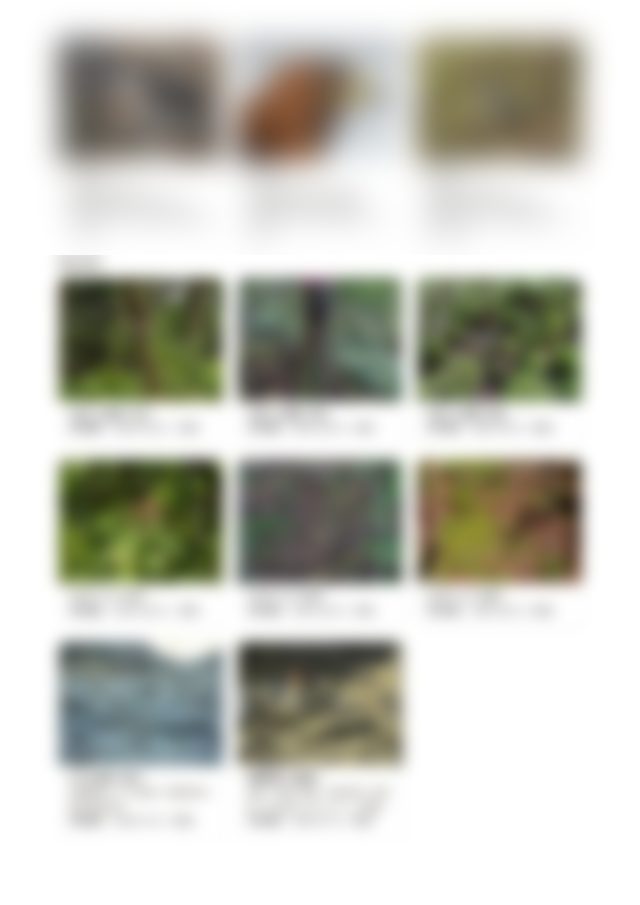
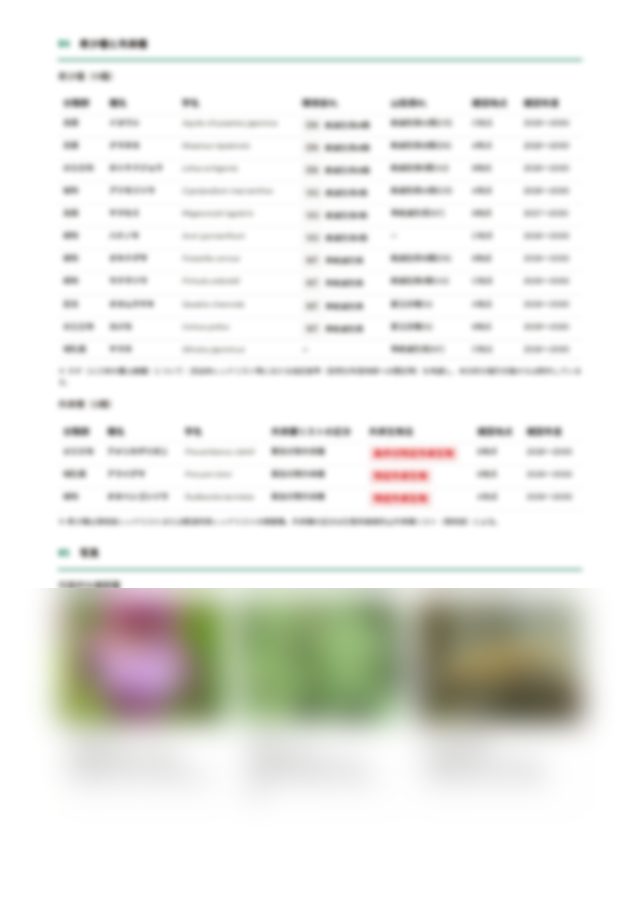
During the survey, we send interim reports that include photos of the plants and animals recorded on site. Each annual report proposes concrete conservation measures for each site.
Materials for certification and disclosure
Delivered in a form ready to use for Nature Symbiosis Site applications, TNFD disclosure, environmental impact assessments and more.
Where
Ecosystem data from many kinds of land,
with minimal manual effort
From large forests to individual homes, sites of any size, from under one hectare to several hundred hectares or more, can be measured.
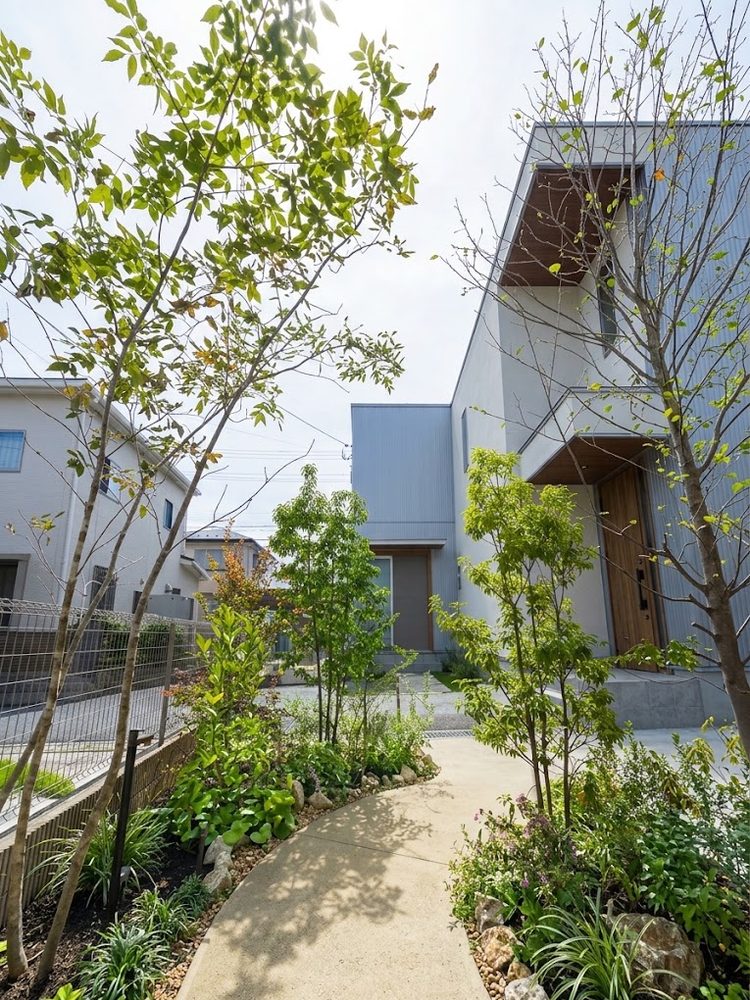

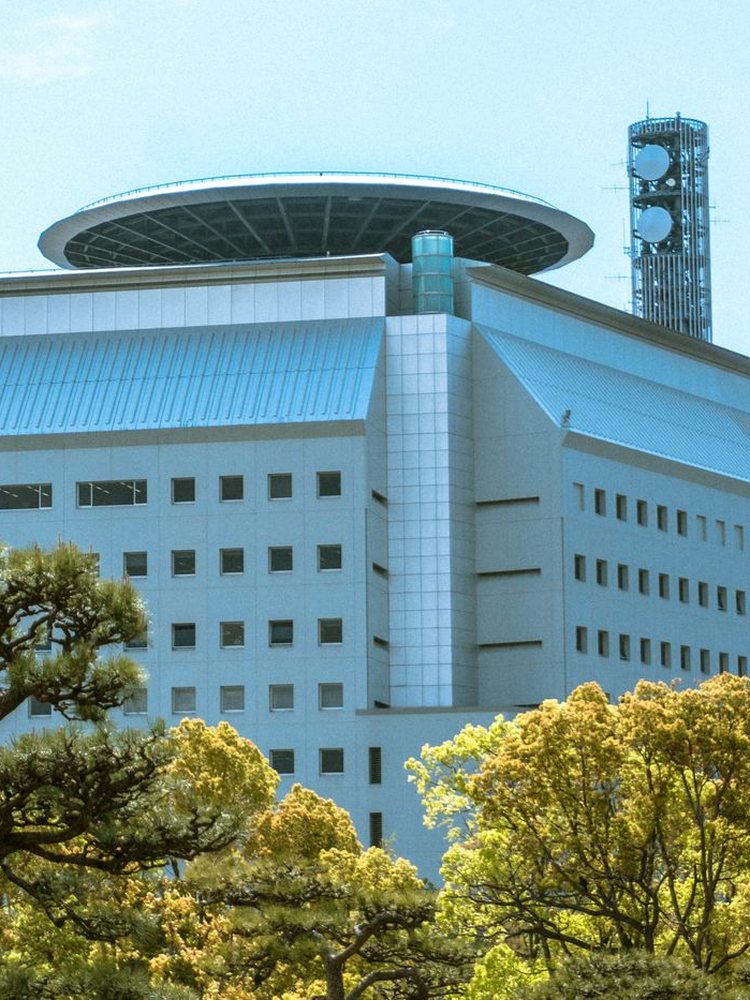
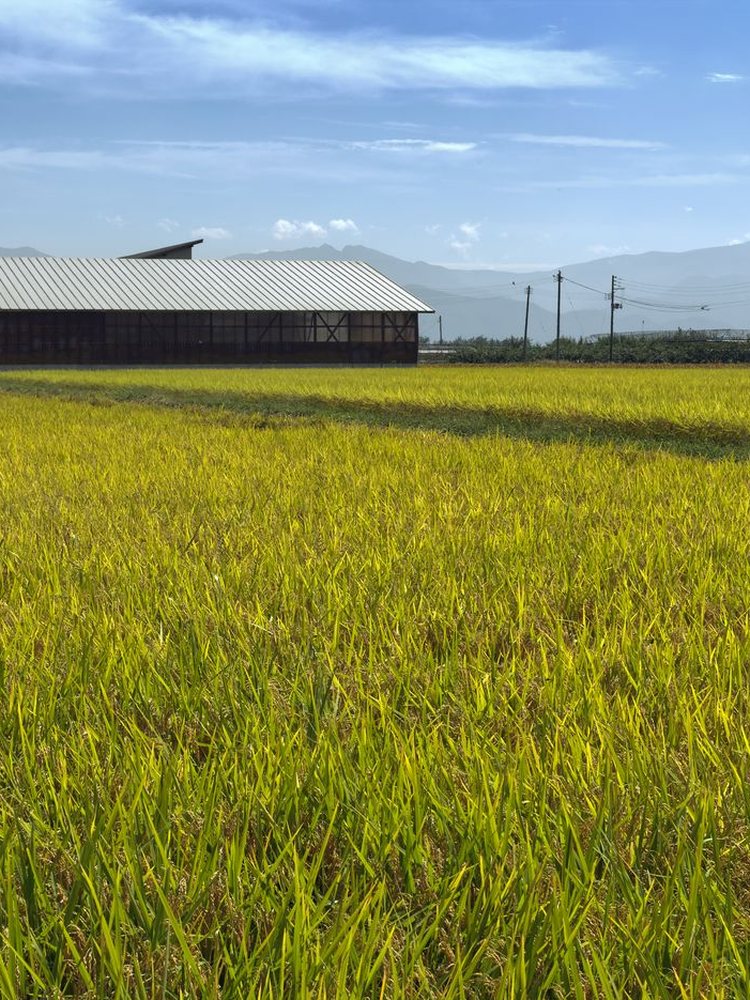
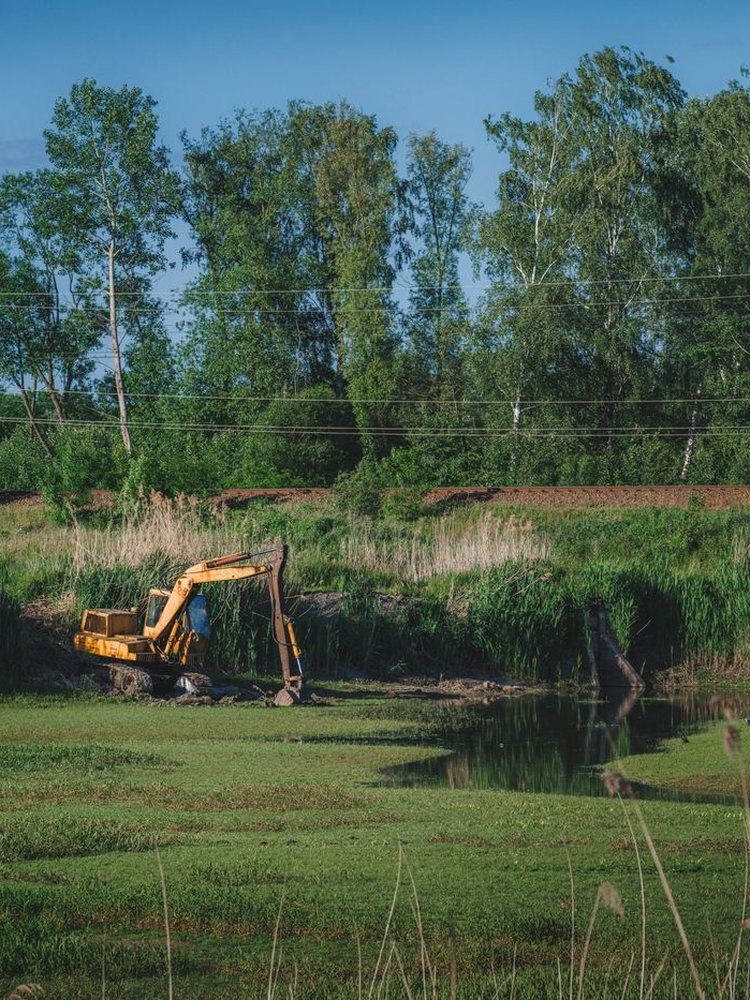
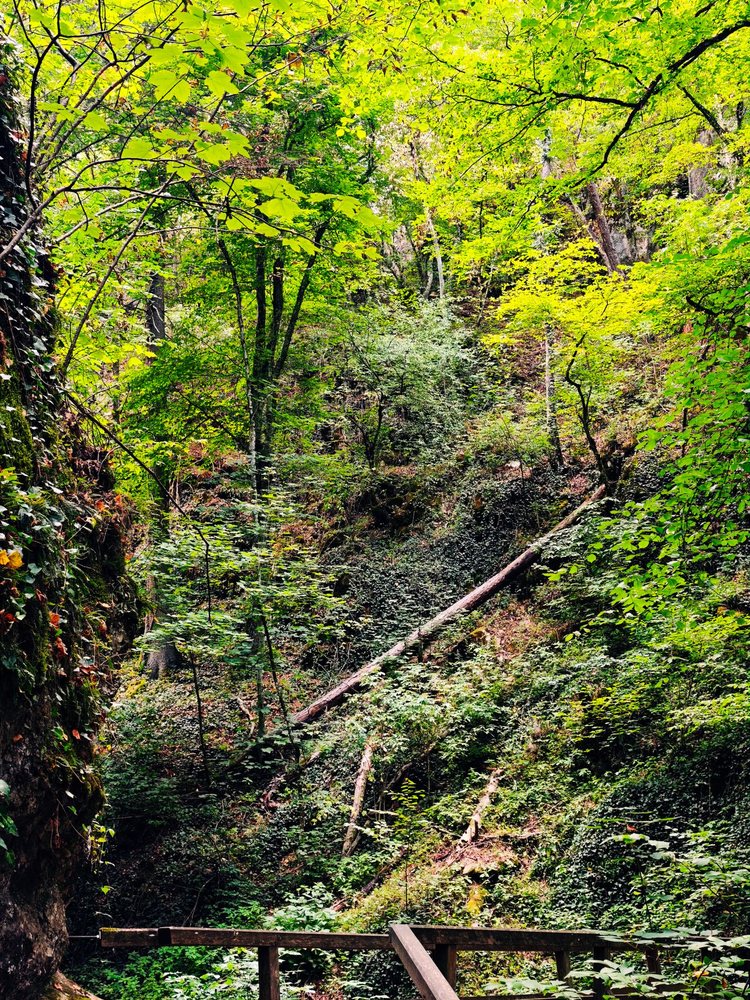
Once deployed, our sensors record continuously. From steep, hard-to-reach terrain to urban green spaces that need careful site coordination, surveys continue with fewer site visits.
Contact
Data solutions tailored to
your land holdings and operating sites
From Nature Symbiosis Site applications to TNFD disclosure, we provide guidance tailored to your site conditions and goals.
Contact us